A Cup of JOE (4/8)
No News Is Good News in Job Opening Trends
Marissa Hashizume, NLx Research Hub Economist
April 8, 2026

Welcome to A Cup of JOE, a blog series. Each post will serve up fresh insights into U.S. job openings using the NLx Job Opening Estimator (NLx JOE) — a tool that blends federal government data with NLx Research Hub data and analytics to provide timely, detailed estimates of labor demand trends. Whether you’re a workforce professional, researcher, or just curious about employment opportunities, this series will keep you informed on interesting and emerging trends in labor demand, supporting data-driven decision-making and broader awareness of what is happening in the labor market.
In our Cup of JOE blogs from December, we covered trends in job openings, opening rates, and labor market tightness over the past two years. Since then, the November openings drop we noted progressed into an even larger drop in December. Fortunately, openings mostly recovered in the first three months of this year. While we’re still slightly below this time last year (average of 7.6M openings per month in Q1 of 2025 vs average of 7.4M openings Q1 of this year), the steady and dramatic decline that we had been seeing post-COVID has not resurfaced. In the past 12 months, openings hovered around 7.3M each month, with peaks of 7.5M in May, August, and last month (March), and a trough of 7.0M in December.
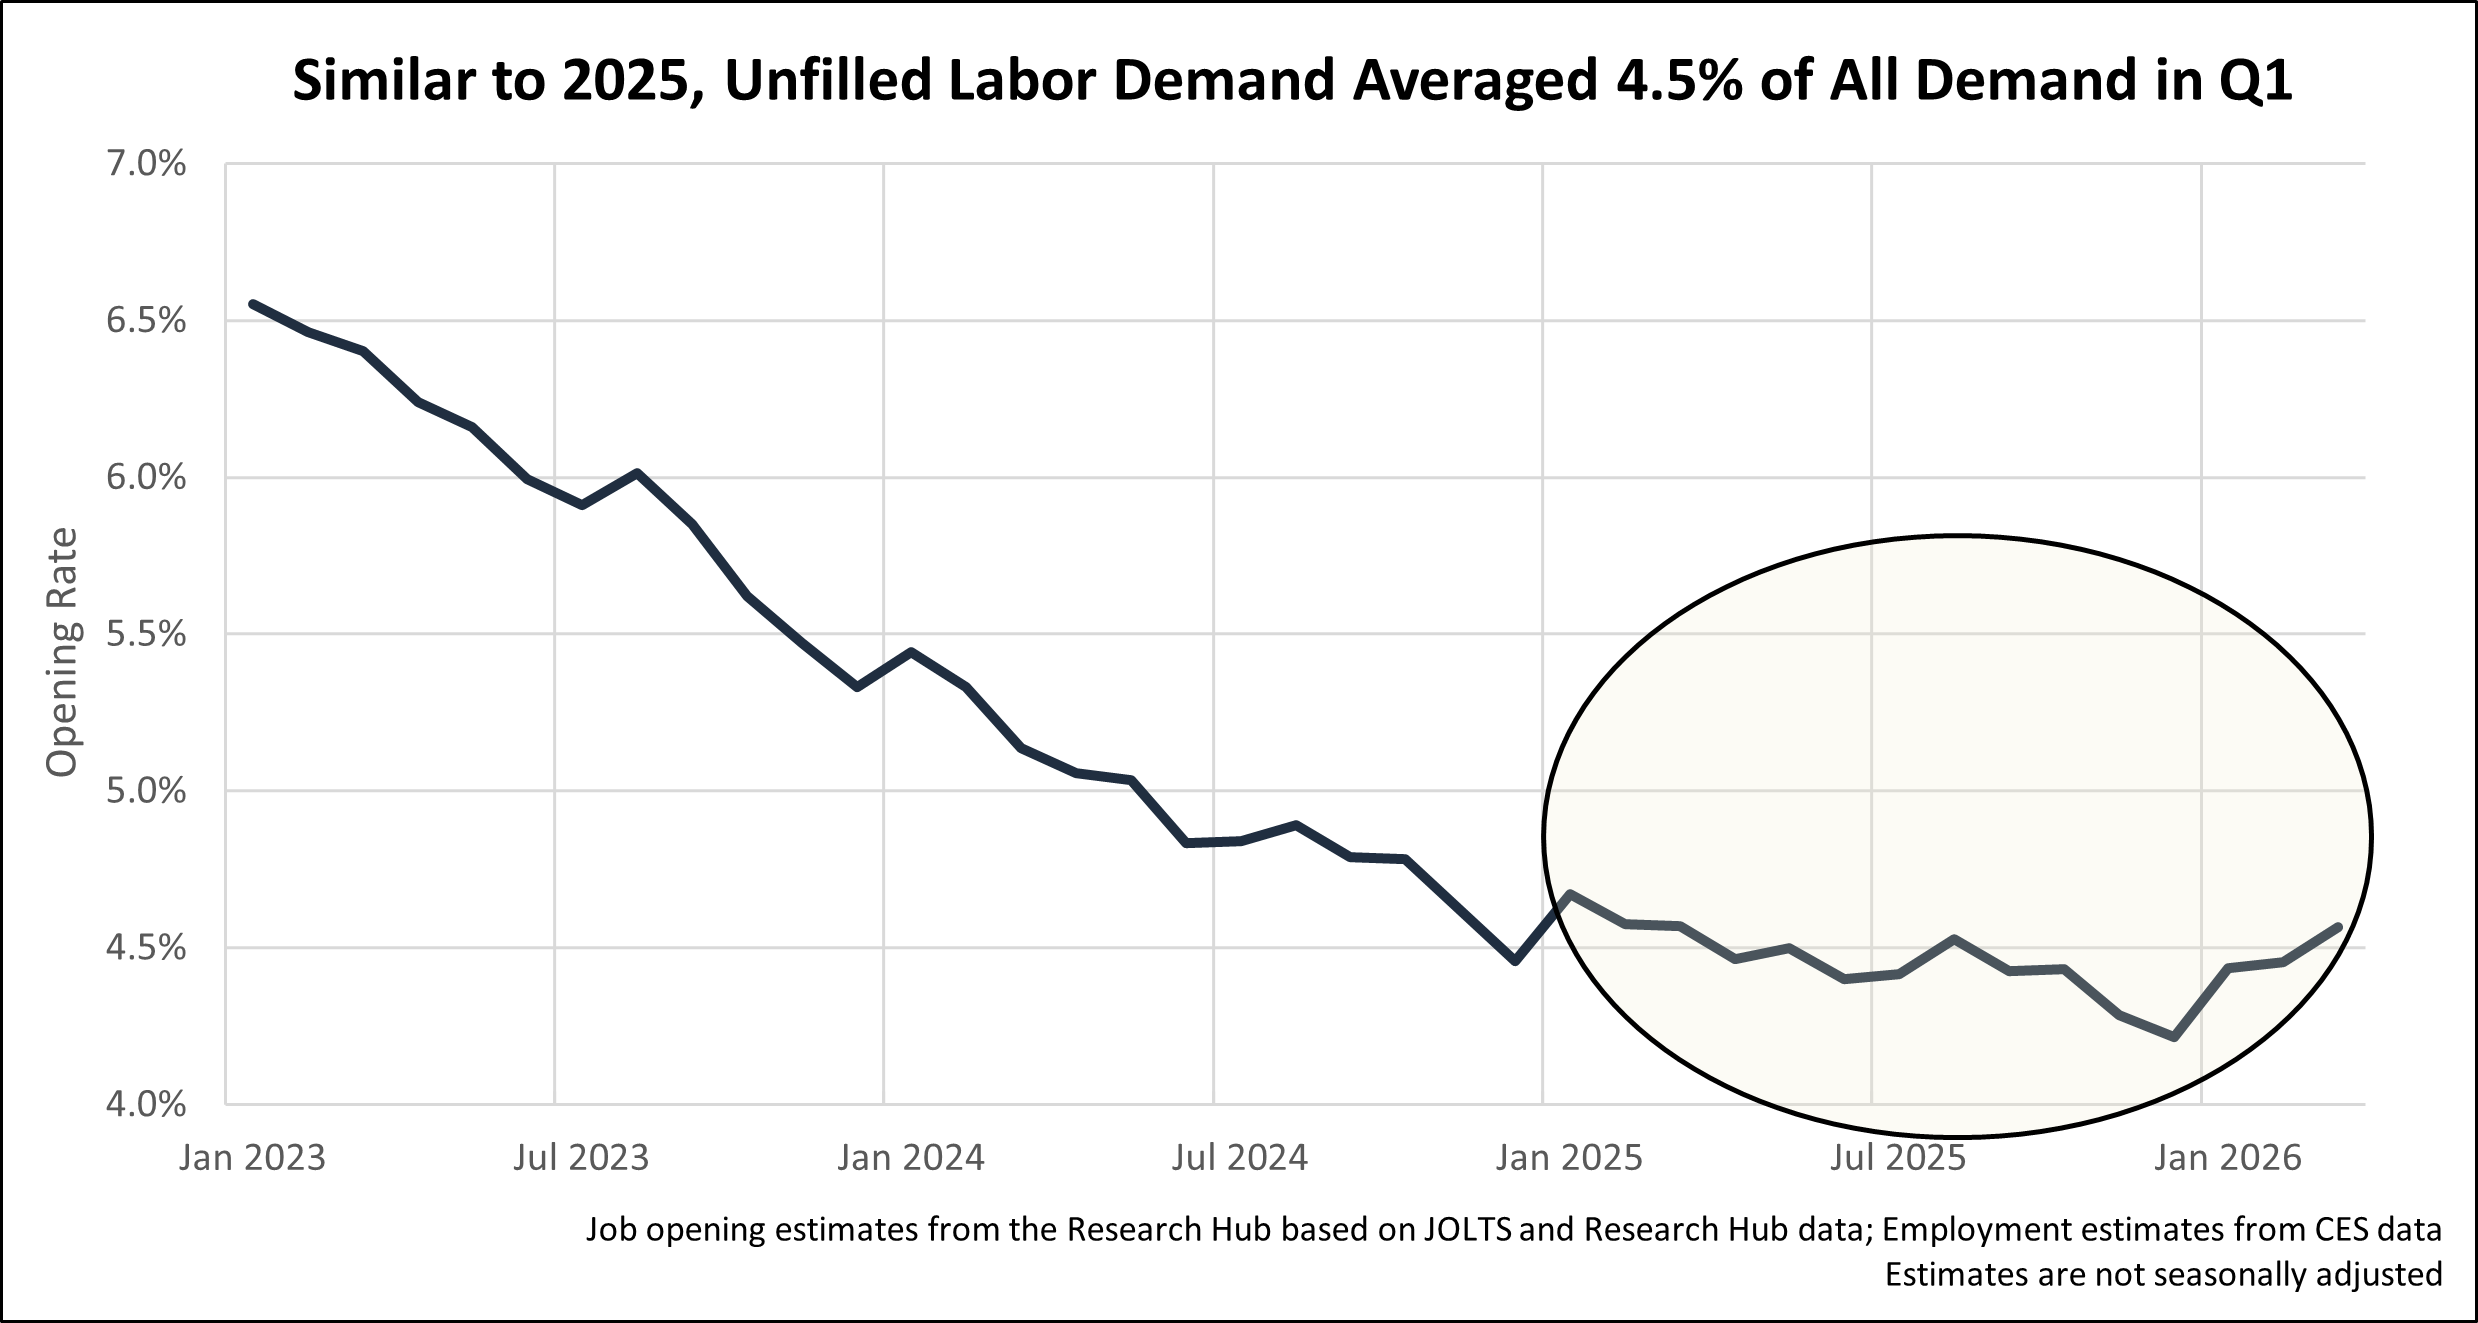
The opening rate – a measure of unfilled labor demand as a portion of all labor demand – is still following a similar pattern to openings since employment levels are staying relatively stable. After the December dip to 4.2% of labor demand being unfilled, we’re back up to an average of 4.5% for Q1, which is only slightly less than the 4.6% average for Q1 of 2025. In other words, the portion of labor demand that is unfilled has maintained a relatively consistent level in the past year.
Openings per unemployed person – a measure of labor market tightness – has taken a little longer to steady out post-COVID than openings or the opening rate. Even though openings were stabilizing last year, unemployment was still creeping up enough to continue the trend of a loosening labor market (fewer openings per unemployed). However, it does seem to be leveling off since last summer. As expected (see the December Cup of JOE blog), the cyclic nature of (not seasonally adjusted) unemployment gave us a drop in openings per unemployed from December to January, but a small tightening again in March. In other words, while there have been cyclic bumps, we’re no longer seeing the large declines that we were seeing through mid-2025. Since last July, we’ve hovered around or just under the balance point of one opening per unemployed person, with the Q1 average of 0.95. If this trend continues, we may have landed very nicely at a balanced labor market. We will see.
Note that unemployment data is unavailable for Oct. 2025 due to the government shutdown. We have filled in the missing unemployment data with the average of Sep. and Nov. unemployment to avoid a gap. Please see this BLS announcement for more information on the impact of the shutdown on the CPS statistics, including higher standard errors for Nov. 2025.
In light of this benign Q1 recap of job openings, two things should be noted: First, different stories are playing out in other areas of the labor market that we don’t cover in these job opening blogs. For example, hiring is of particular importance right now as we try to understand how labor demand aligns with labor supply. As hiring numbers continue their slow descent, more questions are raised about how well the labor force is situated to meet demand even as we are seeing stabilization on the demand side. Second, an increase in global turmoil in the past month or so had only just begun as of the most recent data points. We will likely see that turmoil make its way into labor market data in the coming months.
***A Cup of JOE examines job opening estimates from the NLx Job Opening Estimator (NLx JOE). Explore job opening numbers, see methodology notes, and more on NLx JOE, updated with new estimates monthly. Note that estimates from the most recent months are subject to minor revisions after additional federal data becomes available.***