Openings On the Rise
A Cup of JOE blog post
Marissa Hashizume, NLx Research Hub Economist
October 6, 2026

Welcome to A Cup of JOE, a blog series. Each post will serve up fresh insights into U.S. job openings using the NLx Job Opening Estimator (NLx JOE) — a tool that blends federal government data with NLx Research Hub data and analytics to provide timely, detailed estimates of labor demand trends. Whether you’re a workforce professional, researcher, or just curious about employment opportunities, this series will keep you informed on interesting and emerging trends in labor demand, supporting data-driven decision-making and broader awareness of what is happening in the labor market.
Last quarter, job openings showed a clear upward trend. If you recall from the previous quarter (Q2), there was a downward trend following a peak of 7.5M openings in March 2026. That trend reversed in Q3, with job openings surpassing the March peak and reaching 7.6 million in September. Gains were consistent each month of the quarter, with a large jump between June and July (173k more openings), and smaller increases in August and September (70k and 90k more openings each month, respectively). Overall, Q3 averaged 7.5M openings per month. Job openings were also higher than they were in September last year (7.3M) and Q3 of 2025 in general (7.4M average per month). Whether this signals a change in longer term trends or is just a reversal of the drop we saw in Q2 is not yet clear. Either way, it was good news for openings in Q3.
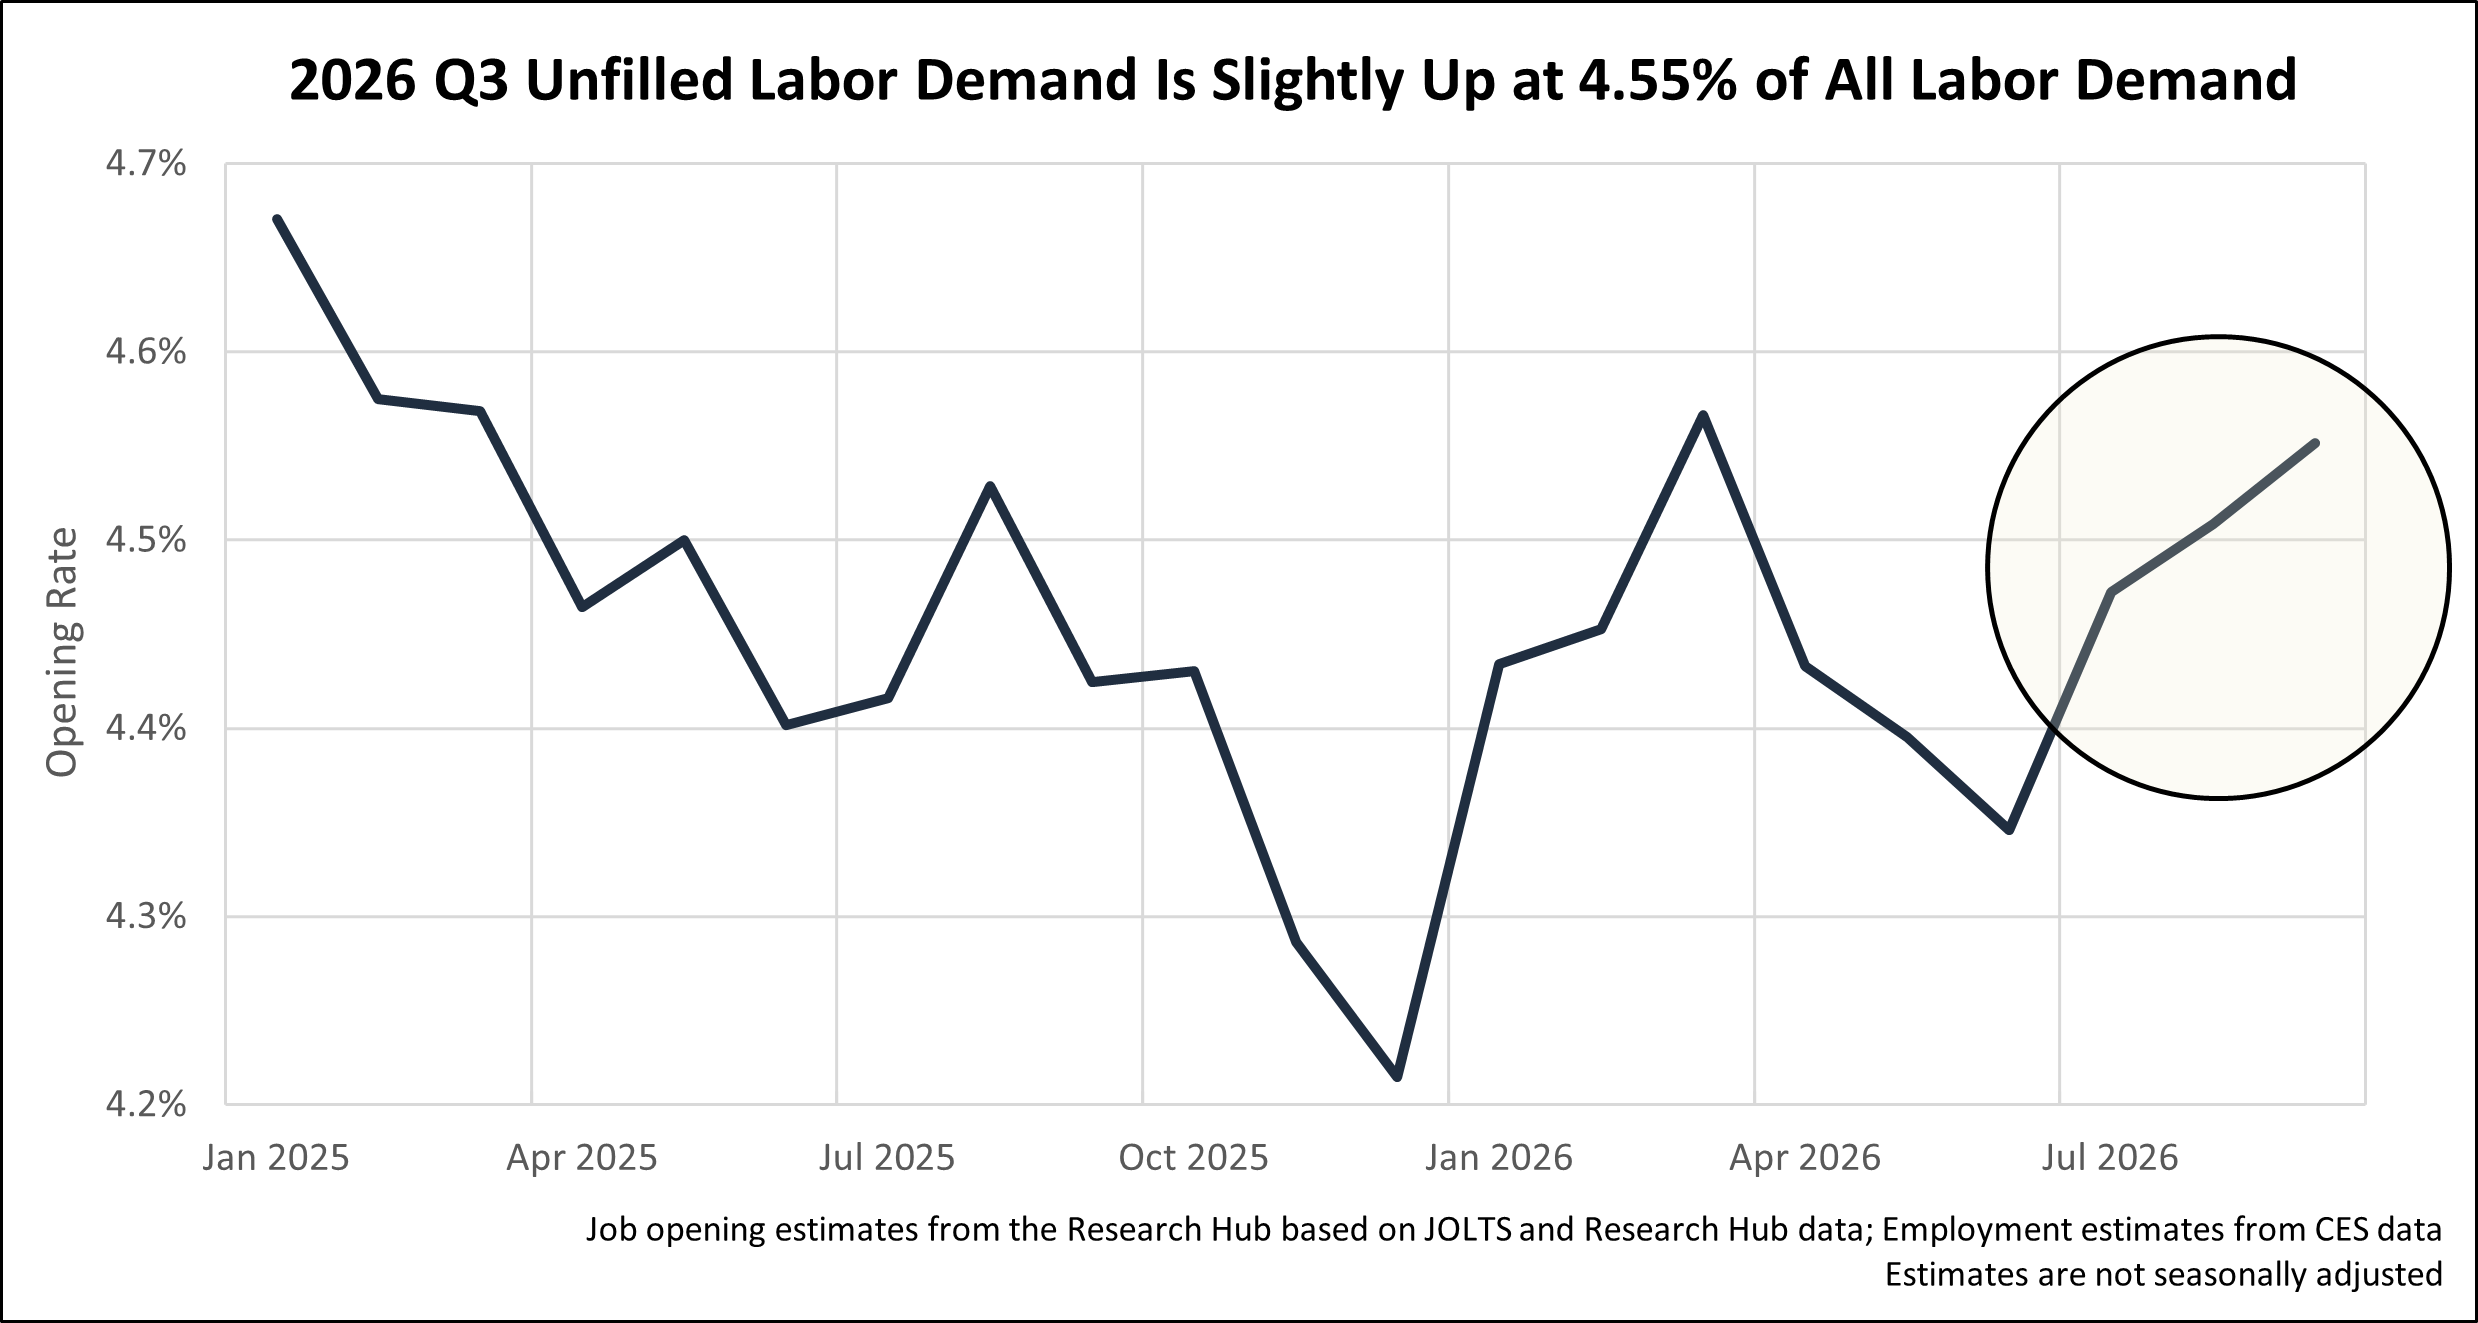
The portion of labor demand that is unfilled (the job opening rate) also rose last quarter, but less dramatically than openings. In other words, the rise in openings was partially (but not completely) met by a rise in employment. We ended Q3 with an opening rate of 4.55%, up from a low of 4.35% in June and also up from last year (4.42%).
The increase in openings this past quarter was also reflected in a tightening of the labor market. In other words, the number of openings per unemployed person also increased. While we had been hovering around the 1-to-1 ratio of a balanced labor market for the past year, we are now straying upwards to a tighter labor market. However, this ratio does fluctuate from month to month and quarter to quarter, so we’ll have to see if this is a new trend or just a reversal of last quarter’s (slightly smaller but still real) drop.
Note that unemployment data is unavailable for Oct. 2025 due to the government shutdown. We have filled in the missing unemployment data with the average of Sep. and Nov. unemployment to avoid a gap. Please see this BLS announcement for more information on the impact of the shutdown on the CPS statistics, including higher standard errors for Nov. 2025.
June was the first time in a while that three of the four U.S. regions were nearly perfectly balanced. The only region that was not balanced was the West, which historically has fewer openings per unemployed person than the other regions. However, since then, the South and Midwest reversed their trends and started getting tighter, while the Northeast and the Midwest stayed around the same or even saw a bit of a decline. We do not yet have September unemployment data at the regional level but given that the nation overall continued to tighten in September, it’s likely that the South and Midwest continued to tighten last month. We’ll have to wait to see if the Northeast and West followed suit.
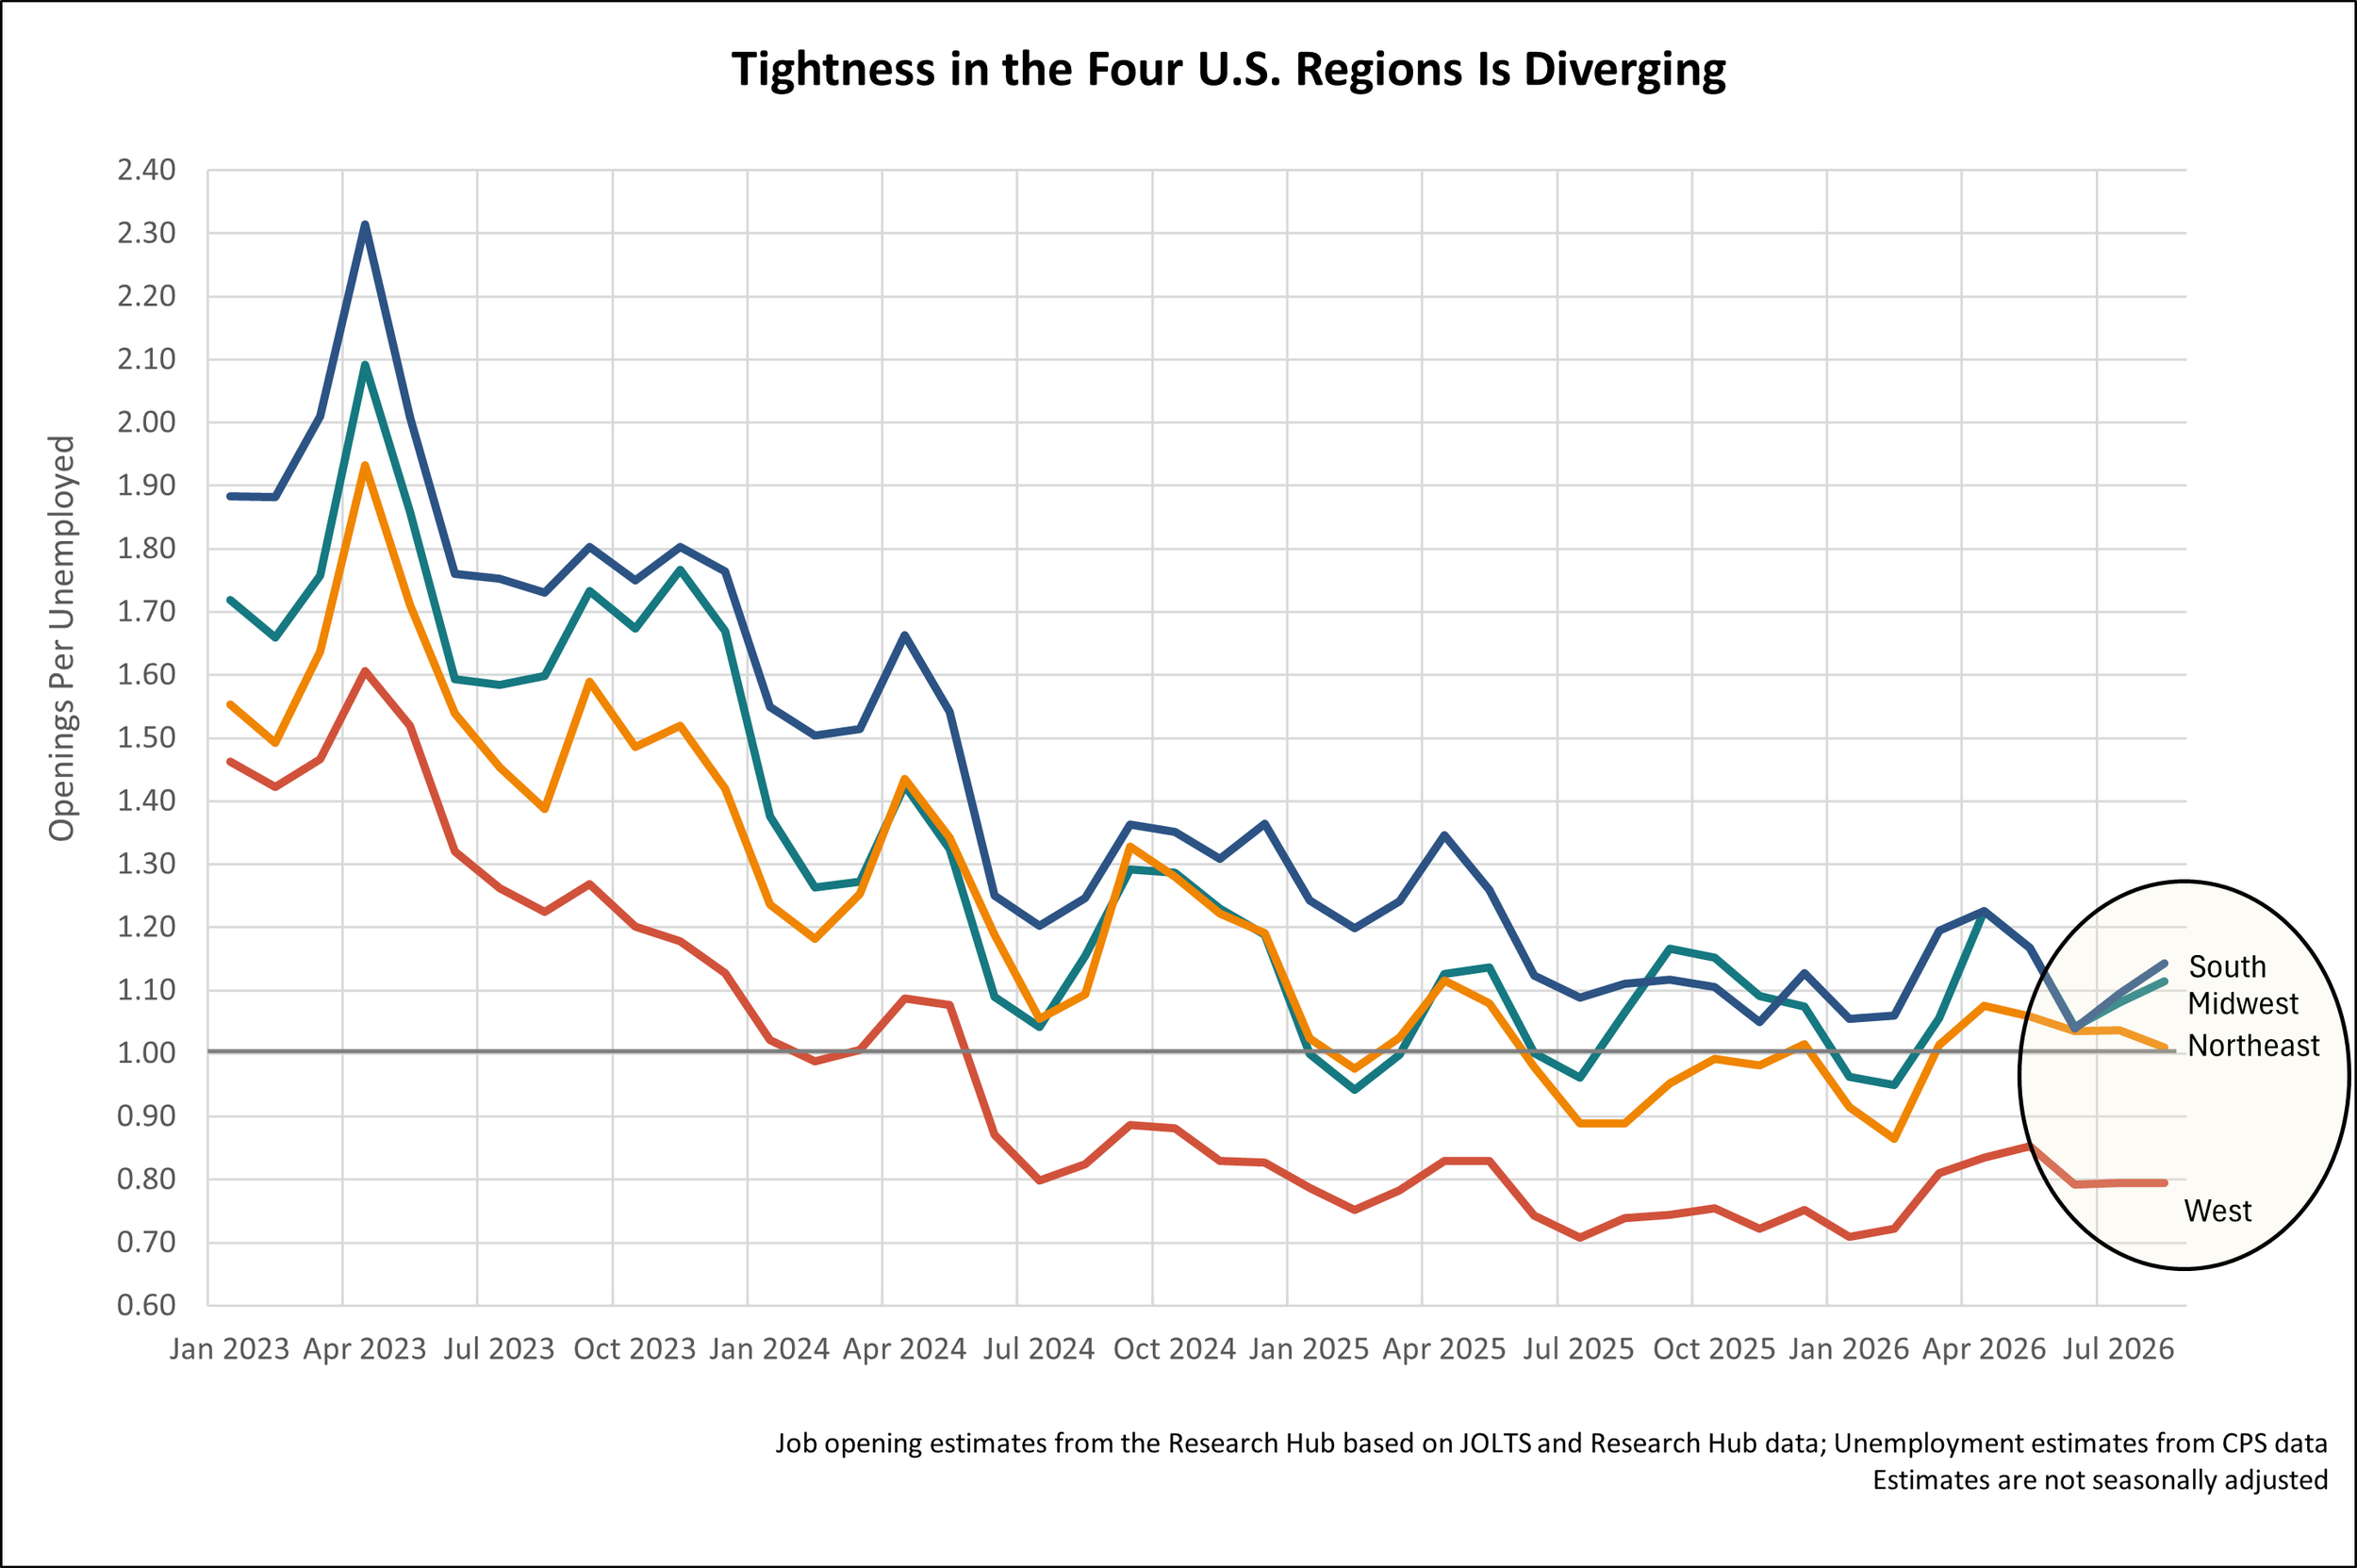
Note that unemployment data is unavailable for Oct. 2025 due to the government shutdown. We have filled in the missing unemployment data with the average of Sep. and Nov. unemployment to avoid a gap. Please see this BLS announcement for more information on the impact of the shutdown on the CPS statistics, including higher standard errors for Nov. 2025.
***A Cup of JOE examines job opening estimates from the NLx Job Opening Estimator (NLx JOE). Explore job opening numbers, see methodology notes, and more on NLx JOE, updated with new estimates monthly. Note that estimates from the most recent months are subject to minor revisions after additional federal data becomes available.***